In this post, I will share a Power BI implementation designed to visualize a portfolio of digitization projects. The goal was to create a compact, single-page report that clearly communicates project progress, status breakdown, developer workload, and future extensibility via KPI placeholders.
Business Requirements
The input was a structured dataset with approximately 100 internal projects, each including:
- Project Title
- Start Date, UT Date, UAT Start Date, Go Live Date
- Project Status (Completed / In Progress / Not Started)
- Developer
- Tags and Metadata
The reporting requirements were:
- Visualize project timelines
- Show distribution by project status
- Present developer-wise project assignment
- Provide space for 5 KPI boxes (placeholders for now)
- Enable future extensibility without redesign
Technical Approach
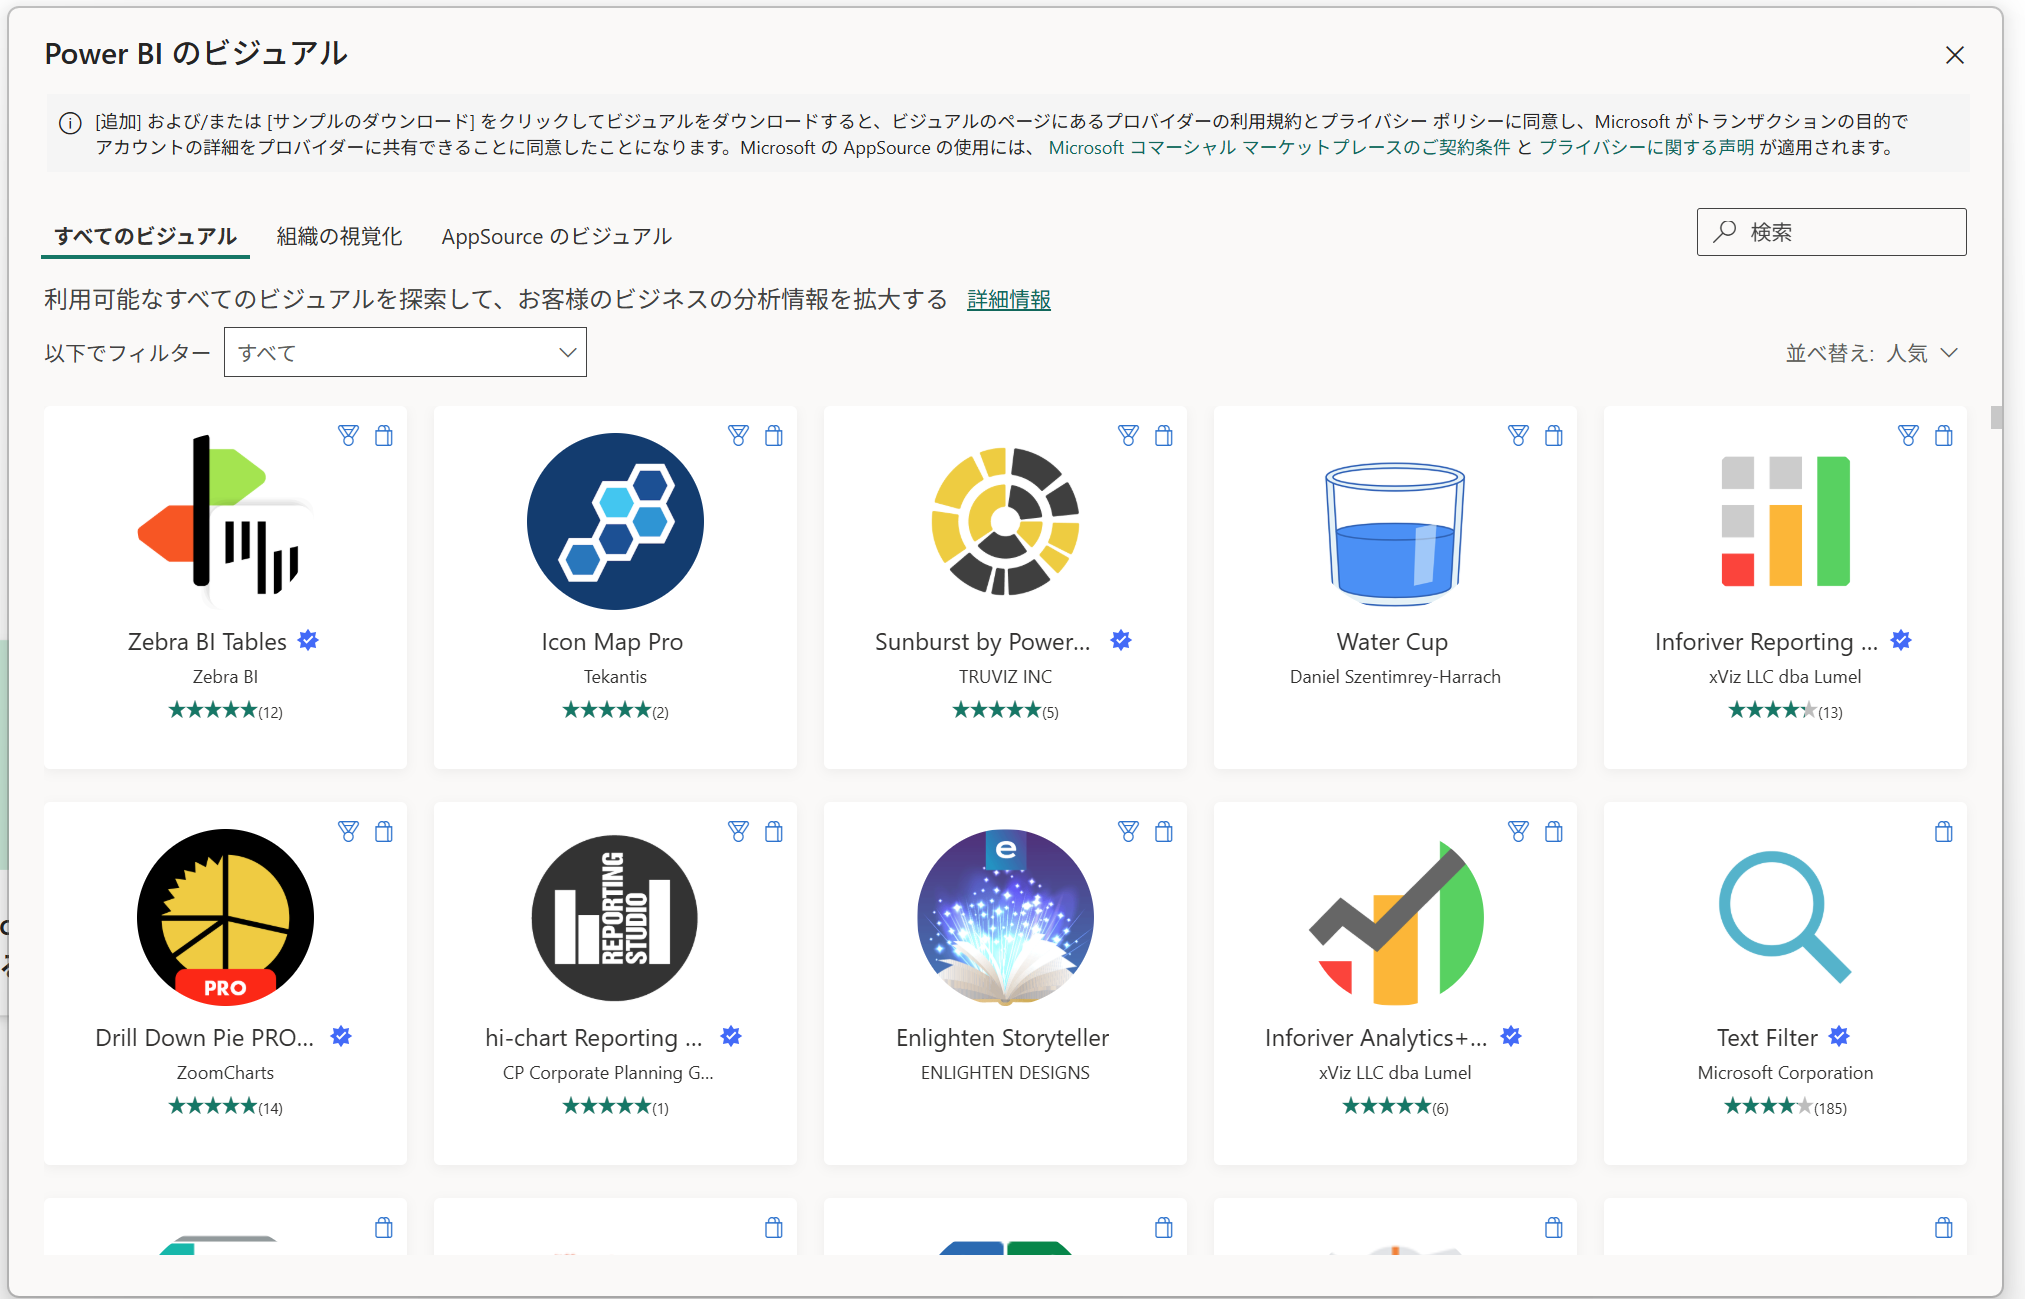
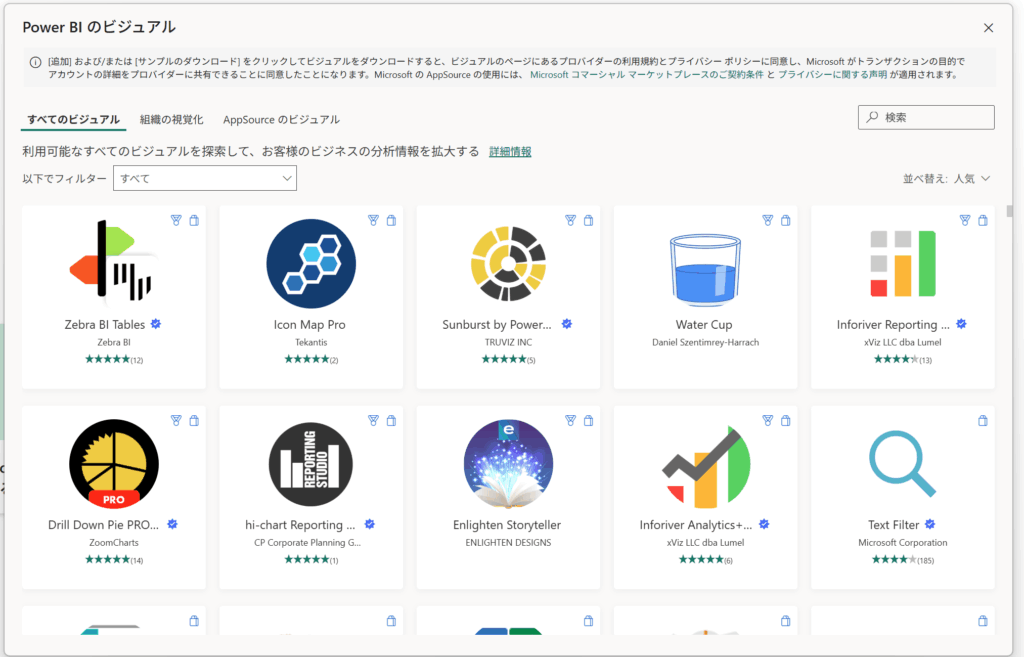
The solution was built in Power BI using the following visualizations:
1. KPI Placeholders
Created 5 card visuals, initially showing total project count. These act as reserved spaces for metrics like:
- Overdue project count
- Average duration
- % Completed
- Upcoming deadlines
- Custom business KPIs
2. Donut Chart – Project Status Distribution
The Donut Chart summarizes project count by status:
- Completed
- In Progress
- Not Started
3. Treemap – Developer Assignment
A Treemap was used to show the number of projects per developer. This is useful for:
- Team capacity visualization
- Workload balancing
- Identifying resource concentration
Each rectangle represents one developer, sized by project count.
4. Gantt Chart with Milestones
A custom Gantt Chart (e.g., Gantt by MAQ Software) was selected. Configuration:
- Category: Project Title
- Start: Start Date
- End: Go Live
- Legend: Project Status
- Data Label: Developer
- Milestones: UT, UAT Start, Go Live, Start
Each milestone is visualized as a diamond, and the Today line helps identify progress or delay.
The visual effectively replaces manual tracking tables and gives a real-time portfolio overview.
Key Implementation Notes
・Milestones are independent of the bar range and can be added via “Task Milestones” field.
・If certain dates are optional (e.g., UT), nulls are automatically skipped without error.
・For best layout, the page used gridlines and grouping (e.g., left-aligned KPIs, center-aligned charts).
・No DAX was required; all metrics and filters were built using raw dataset and standard visuals.
・All visuals are cross-filterable, supporting intuitive drill-down.
Summary
| Feature | Implementation |
|---|---|
| Project Overview | Gantt chart with milestone tracking |
| Status Distribution | Donut chart with 3-color segmentation |
| Resource Overview | Treemap by developer |
| KPI Summary | Placeholder cards |
| Tech Stack | Power BI (OOB visuals + MAQ Gantt) |
| Input | Excel table with 100+ project records |
Closing Thoughts
For internal portfolios, Power BI offers a practical and scalable way to deliver structured visibility. With built-in visuals and simple configuration, even non-developer teams can maintain and extend such dashboards.
This type of solution is particularly effective for Dynamics 365 or Power Platform-based organizations where Excel remains the common data source but visibility is lacking.
コメント